
The Federal Reserve appears ready to pursue yet another untested strategy that could ultimately boost inflation – and possibly prices for bitcoin.
The Fed is “preparing to effectively abandon its strategy of pre-emptively lifting interest rates to head off higher inflation,” according to a new report in the Wall Street Journal.
The shift signals an explicit willingness by the central bank to tolerate higher inflation, at a time when the spreading coronavirus continues to ravage the economy. The U.S. unemployment rate stands at 11%, a level not witnessed since the early 1940s until this year.
The Fed’s extra loosening of monetary policy could help support prices for bitcoin, which many cryptocurrency investors speculate could serve as an effective hedge against inflation, similar to gold. Bitcoin prices have already soared 58% this year, beating silver’s 36% and gold’s 30%, not to mention the 2% gain in the Standard & Poor’s 500 Index of large stocks.
Bitcoin rose 1.5% on Monday to $11,338.
“As more investors look to ‘digital gold’ as an inflation hedge in an increasingly digitized world amidst unprecedented government money printing,” the cryptocurrency research firm Messari wrote Monday, “we know that it won’t take much of an institutional allocation until $50,000 bitcoin is back on the table.”

The Fed already has taken monetary policy to a new level of extraordinary this year, pumping nearly $3 trillion of freshly created money into financial markets earlier and pushing its total assets to about $7 trillion. A growing number of investors in both digital-asset and traditional markets say the flood of dollars could whittle down the U.S. currency’s purchasing power.
The dollar index, a gauge of the the currency’s strength in foreign exchange markets, fell 4% in July, the biggest monthly drop since 2010. And the Wall Street brokerage firm Jefferies now predicts that the dollar could fall as much as 15%, according to CNBC.
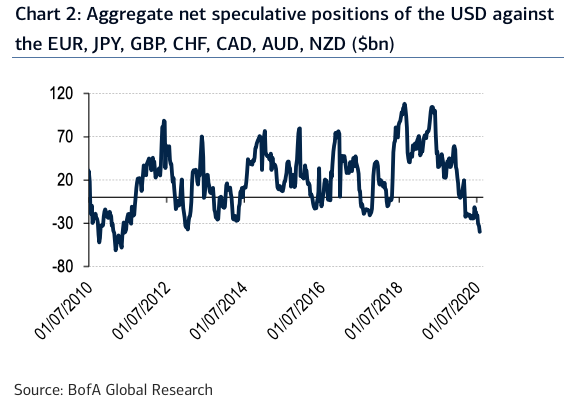
Bank of America analysts wrote Monday in a report that it’s becoming a popular trade to bet against the dollar, since investors are “worried about the long-term impact of the rapid accumulation of U.S. debt for the U.S. dollar’s reserve-currency status.”
“As gold, silver, equities, and long bonds reach record high levels, and the U.S. dollar slumps, the king of cryptocurrencies may be back in the spotlight for the foreseeable future,” Jeff Dorman, chief investment officer of the cryptocurrency-focused firm Arca, wrote Monday in a weekly blog.
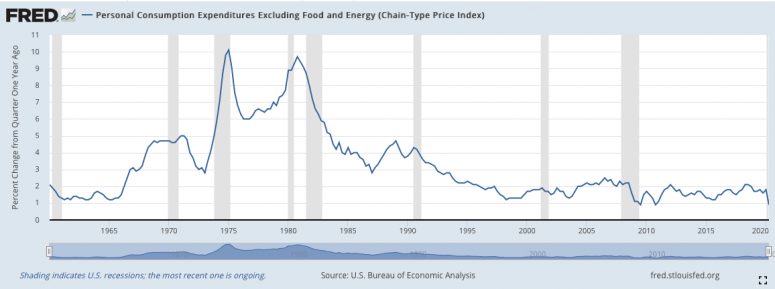
Under the Fed’s policy shift, according to the Wall Street Journal, the central bank would allow inflation to drift above a 2% target before raising rates. The idea is that above-target inflation would offset periods where consumer price increases were previously below the mark, as has been the case for most of the past two decades.
The goal is not to increase inflation per se, but to provide assurances to investors that interest rates would remain low for a long time, according to the paper. Such accommodation could help to assure a faster economic recovery.
Yet, higher inflation could further distort already uncanny signals emanating from bond markets, further undermining the dollar’s attractiveness. Nominal yields on 10-year U.S. Treasury bonds are currently around 0.6%, close to historic lows. Once inflation is factored in, the “real yields” equate to negative 1%.
Assuming nominal yields don’t rise much anytime soon, an inflation rate above 2% would cause bond investors to fall even further behind.
“Negative real rates imply a loss in purchasing power from holding U.S. Treasuries, the ideal conditions for non-income producing assets such as gold and silver but also crypto assets like bitcoin,” the analysis firm Delphi Digital wrote on July 31.
There’s some risk that a fresh panic in markets might prompt investors to rush back into dollars, which could mean a redux of the March crash in bitcoin prices.
But according to an Aug. 2 Bloomberg News story, the next “risk-off scenario” might not see investors rushing into dollars, due to the “flood of liquidity unleashed by the Fed.”
“Any haven rally is likely to be shallower than in previous years,” according to the report, “while the possible extent of depreciation remains the same.”
“Everything hinges on the dollar right now,” Mati Greenspan, founder of the cryptocurrency-focused research firm Quantum Economics, wrote Monday in an email to subscribers.
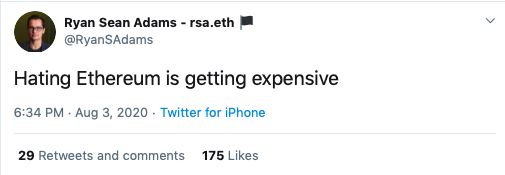
Tweet of the day
Bitcoin watch
BTC: Price: $11,186 (BPI) | 24-Hr High: $11,480 | 24-Hr Low: $11,164
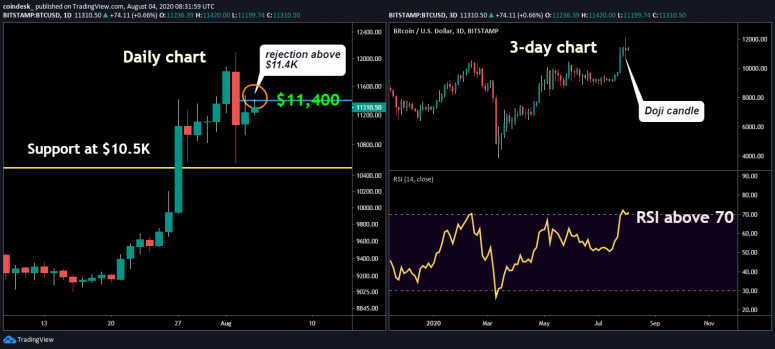
Trend: Bitcoin is again struggling to find a foothold above $11,400 amid signs of buyer exhaustion on the three-day chart.
The number one cryptocurrency by market value is currently trading near $11,290, having hit a high of $11,424 during the Asian trading hours. Tuesday is the second straight day of bull failure above $11,400. Prices hit a high of $11,480 on Monday, but printed a UTC close below $11,240.
Essentially, bitcoin’s recovery rally from Sunday’s “flash crash” low of $10,659 has stalled with the area above $11,400 acting as stiff resistance.
The bulls need quick progress now, or the focus would shift to the uptrend exhaustion signaled by a major doji candle seen on the three-day chart.
A doji occurs when prices see two-way business during a specific period. While it is usually considered a sign of indecision, in this case, it has appeared following a notable rally to 11-month highs above $12,100. As such, it represents buyer fatigue.
The three-day chart’s relative strength index (RSI) is also reporting overbought conditions with an above-70 reading. Thus, a pullback to $11,000 can’t be ruled out. A move below that psychological support would expose the former hurdle-turned-support at $10,500 (February high).
Alternatively, a sustained move above $11,400 on the hourly chart would strengthen the case for a re-test of recent highs above $12,000.

The leader in blockchain news, CoinDesk is a media outlet that strives for the highest journalistic standards and abides by a strict set of editorial policies. CoinDesk is an independent operating subsidiary of Digital Currency Group, which invests in cryptocurrencies and blockchain startups.