
After reaching above 30 cents last week, XRP has taken a step back to make a decision on where it wants to head next. A textbook doji closed on the weekly, reflecting indecision in the altcoin.
According to a candlestick pattern potentially forming on the weekly following the doji, a fall below 25 cents will likely signal a reversal, while a close above could be the last major crash before a new surge to all-time highs.
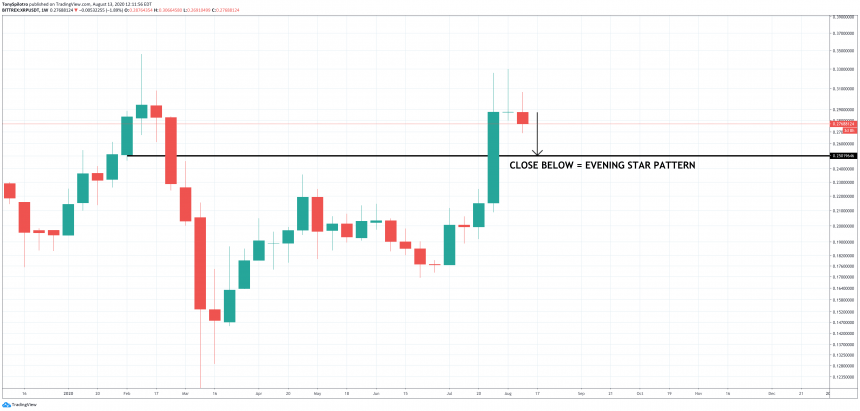
Evening Star Pattern On XRPUSD Weekly If Ripple Drops Below 25 Cents
XRP late last month finally had a strong enough rally to reclaim the number three spot in the cryptocurrency top ten ranked by market cap. Previously, Tether took the spot from the altcoin earlier this year as more stablecoin supply was printed.
The asset went from the worst performing asset in the crypto space for two years running, to the top-performing asset just a couple of weeks ago. But things have since cooled off.
30 cents has proven to be too strong of resistance for Ripple to get through on the first time. However, the cryptocurrency has left a sign of indecision behind with a doji forming on last week’s weekly close.
A powerful move up, followed by a doji and a strong push down, is a clear reversal sign. XRP is at risk of such a move playing out, but only if the altcoin falls below 25 cents per token.
Ripple Weekly Price Chart Evening Star Pattern | Source: TradingView
Will The Reversal Pattern Confirm, Or Will The Cryptocurrency Repeat Its Historic Bull Run?
Strong uptrends topped off by a doji, then followed by a similar strength move by bears, is a Japanese candlestick reversal pattern called an evening star doji pattern.
XRP is at risk of this type of formation closing, but only if the asset closed below 25 cents. But why that level?
Japanese candlestick patterns have certain parameters that must be met for the pattern to be confirmed. For an evening star doji pattern, the candle following the doji must engulf at least 50% of the green candle on the way up to be valid.
Ripple Weekly Price Chart Evening Star Pattern | Source: TradingView
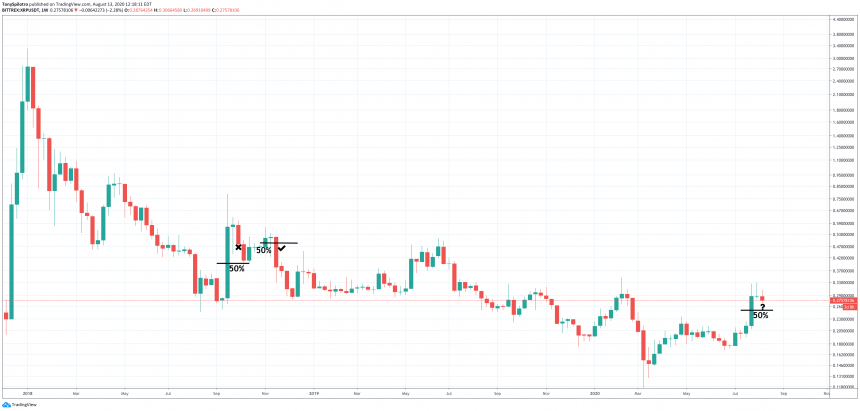
Zooming out shows two examples of this type of patterns side-by-side on XRPUSD price charts from 2018. In the two examples, the first evening star didn’t close below the 50% strike point. The second, however, did and resulted in more downside.
The downside never stopped until the asset bottomed on Black Thursday this year.
Ripple Weekly Price Chart Evening Star Pattern | Source: TradingView
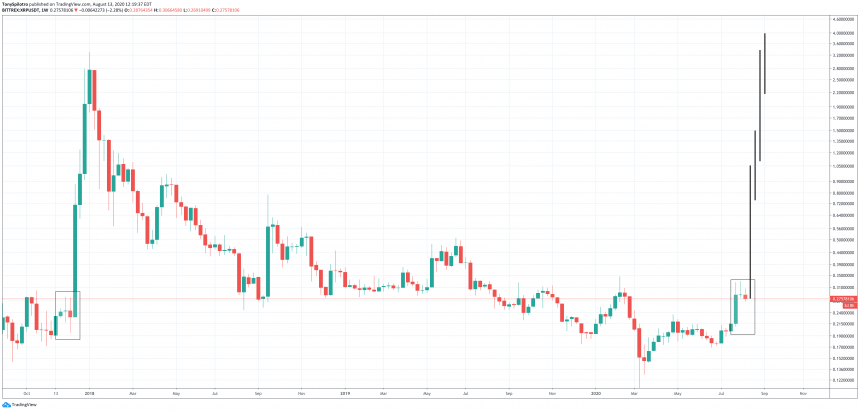
Panning out slightly further reveals the one anomaly on XRP’s price chart that shows a similar structure to the evening star pattern unfolding now. But instead of reversing, Ripple blasted off towards its all-time high.
This one massive move took place across only four weeks and brought the asst close to $4 per token. If a similar fractal plays out, XRP could trade beyond that number in just a few month’s time.
Whatever the case, Ripple bulls will need to show what they are made of, or else bears will regain control and push the asset to new lows.